Previewing in Version 6.3
Dashboards provide at-a-glance views of KPIs (key performance indicators) relevant to a particular objective or business process.
Main Module
These dashboards are available under 'Home' . 
Data Grids
To use one of these dashboards, navigate to the grid, then choose layout, then Open. If the layout is not in your list, press the import button to import the layout into your list.
Main Module Dashboards
| Tool | ID | Name | Sample |
|---|---|---|---|
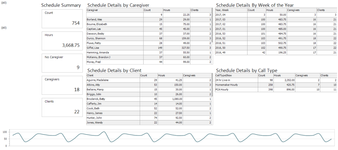
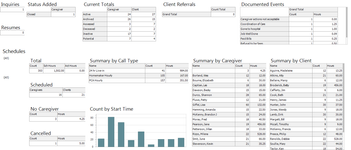
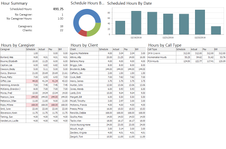
| Schedule Dashboards | h0001 | Schedules Overview |
|
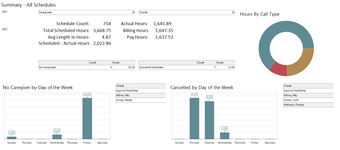
| Schedule Dashboards | h0002 | Schedules - Summary |
|
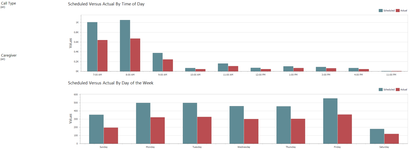
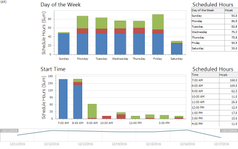
| Schedule Dashboards | h0003 | Schedules - Day of Week and Times |
|
| Schedule Dashboards | h0011 | Cancelled Schedules |
|
| Schedule Dashboards | h0012 | Open Schedules |
|
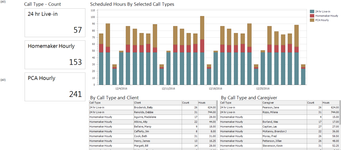
| Schedule Dashboards | h0016 | Count and Hours by Call Type |
|
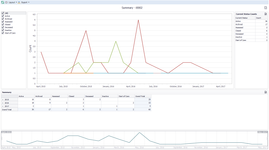
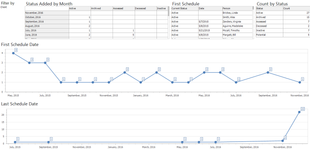
| Management Dashboards | h0004 | First and Last Day Scheduled |
|
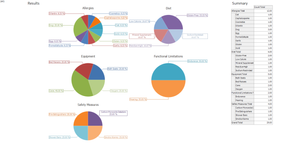
| Management Dashboards | h0005 | Status Added by Referral Source | 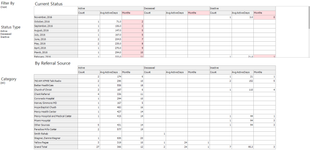 |
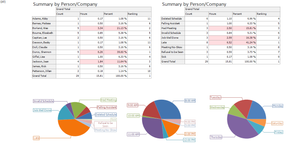
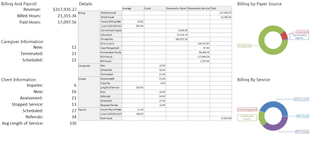
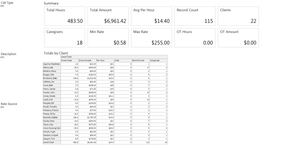
| Management Dashboards | h0006 | Payroll and Billing Summary | 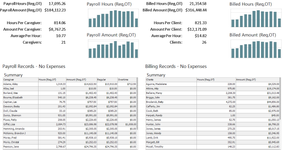 |
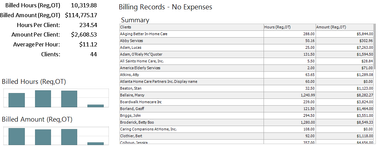
| Management Dashboards | h0017 | Billing Summary |
|
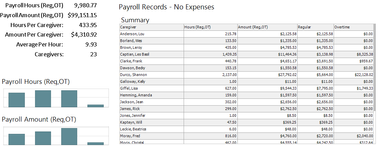
| Management Dashboards | h0018 | Payroll Summary |
|
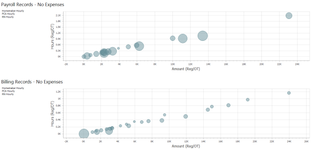
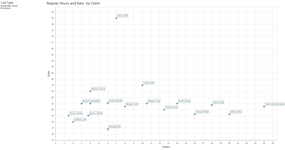
| Management Dashboards | h0007 | Payroll and Billing Scatter Chart |
|
| Management Dashboards | h0008 | Benchmark |
|
| Management Dashboards | h0013 | Daily Achievements | 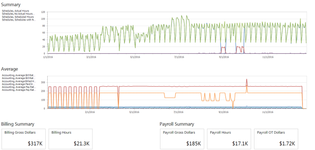 |
| Management Dashboards | h0015 | Quick SnapShot |
|
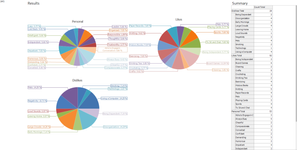
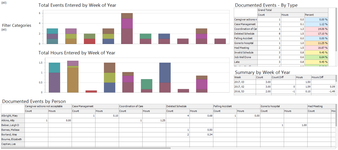
| Documented Event Dashboards | h0009 | Summary by Category |
|
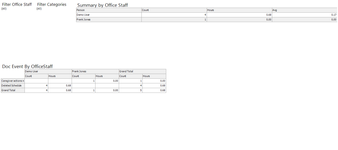
| Documented Event Dashboards | h0010 | Office staff are Involved |
|
| Documented Event Dashboards | h0014 | By Time and Day of the Week | 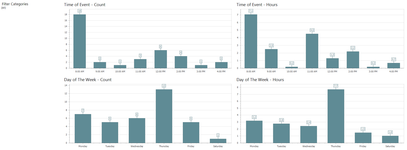 |
Scheduling Data Grid Dashboards
| Tool | ID | Name | Sample | Note | ||||||
|---|---|---|---|---|---|---|---|---|---|---|
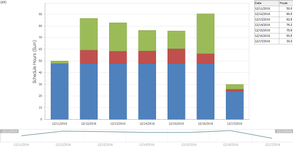
| Process or Review | d0001 | Summary by Day |
| |||||||
| Process or Review | d0002 | Summary by Day of the Week |
| |||||||
| Process or Review | d0003 | Summary by Month | 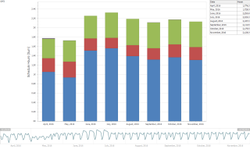 | |||||||
| Process or Review | d0004 | Summary of Finalized Hours |
| After importing this dashboard, you must add two new columns using the column chooser.
After adding these two columns, save your layout again. If you do not add these two columns, the dashboard will not display all the data. | ||||||
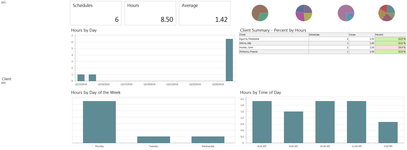
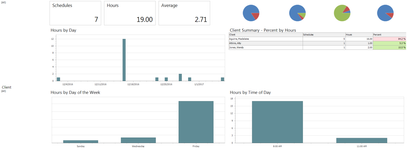
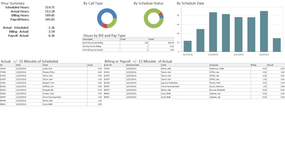
| Process or Review | d0005 | Summary of Hours |
| Rules: if Total or Payroll Hours are:
if Bill Hours or Pay Hours <> Actual Hours, Column is highlighted in Orange |
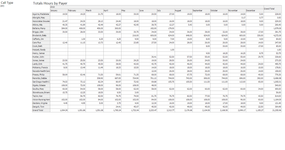
Billing Data Grid Dashboards
| Tool | ID | Name | Image |
|---|---|---|---|
| View Posted Billing | e0001 | Billing Summary |
|
| View Posted Billing | e0002 | Billing Scatter Chart |
|
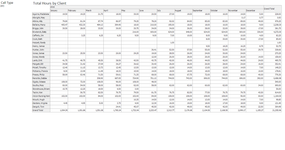
| View Posted Billing | e0003 | Summary by Month by Client |
|
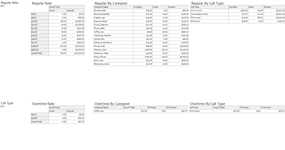
| View Posted Billing | e0004 | Summary by Month by Payer |
|
| View Posted Billing | e0005 | Billing by Rates |
|
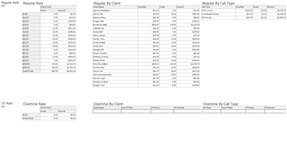
Payroll Data Grid Dashboards
| Tool | ID | Name | Sample | Note | ||||||||
|---|---|---|---|---|---|---|---|---|---|---|---|---|
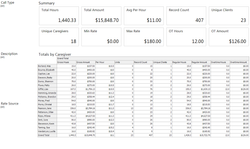
| View Posted Payroll | f0001 | Payroll Summary |
| |||||||||
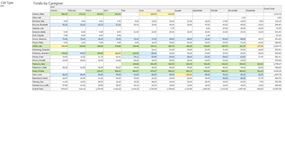
| View Posted Payroll | f0002 | Summary by Month |
| Rules: if Monthly Hours is:
if Grand Total is >= 1560, Name Column is highlighted in Green | ||||||||
| View Posted Payroll | f0003 | Payroll by Rates |
| |||||||||
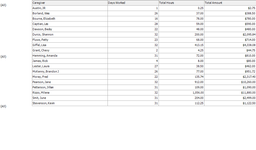
| View Posted Payroll | f0004 | Days Worked by Caregiver |
|
Reporting Data Grid Dashboards
| Tool | ID | Name | Sample | Note |
|---|---|---|---|---|
Status
| i0001 | Average Days in a Status | ||
Status Flow
| i0002 | Summary |
| |
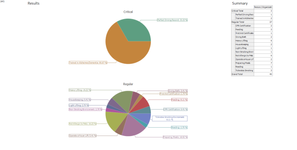
Documented Events
| i0003 | Summary by Category |
| |
Characteristics
| i0004 | Summary by Category |
| |
Skills
| i0005 | Summary by Type |
| |
| Home/Health Evaluation | i0006 | Summary by Category |
| |
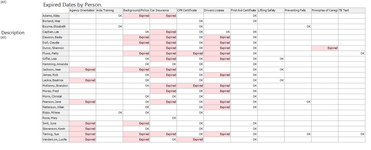
Required Dates
| i0007 | Expired by Person |
| A blank cell means the person does not have the corresponding required date. |